Shifting Gears: Citi Bike Ridership Surge Continues over the Winter

Photo by Colin Brown
By Kelly McGuinness, Transportation Planner, and Daniel Schack, AICP, Senior Associate
The pandemic catapulted the bicycle to new levels of popularity as riders sought an efficient and safe way to travel. In response, cities around the world rapidly set up temporary and permanent biking infrastructure and, nationally, bicycle shops reported historic sales and shortages. Our prior analysis showed that in New York City, Citi Bike ridership recovered more quickly during 2020 than public transit – even though many New Yorkers remain working from home. In September, the service surpassed its record for single day ridership with over 100,000 rides. With the onset of winter, is this trend continuing? And how do New York trends compare to other cold-weather cities? We explore these questions below.
Citi Bike Monthly Ridership
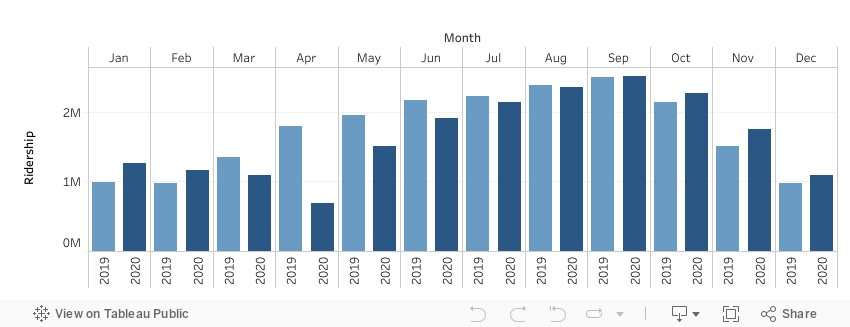
Our analysis of ridership data shows that the “bike boom” has continued into the fall and winter, and ridership has grown since 2019. Compared to 2019, 2020 saw:
1% more trips in September
6% more trips in October
16% more trips in November
13% more trips in December
Citi Bike Trip Temporal Distribution, December 2019 vs. 2020
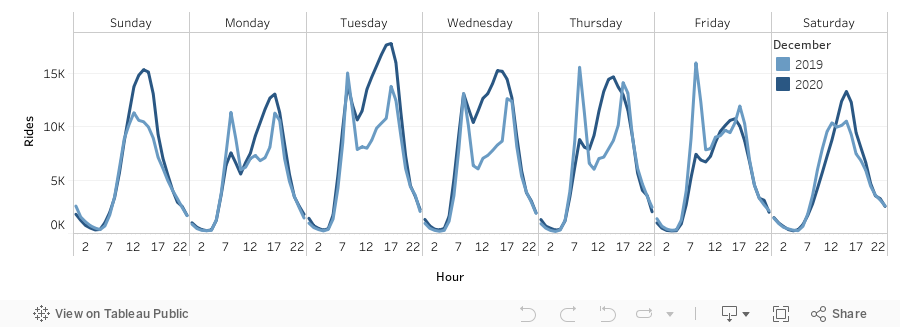
In addition, other characteristics of the trips changed from the past year. Compared to December 2019, in December 2020:
The average trip duration was longer by over 20%—17 minutes versus 14 minutes.
More rides were occurring in the evening hours—peaking between 3 pm and 5 pm instead of pre-pandemic commuting hours of 8 am and 5 pm. (as our previous analysis revealed).
The summer trend of an increasing share of female riders continued: the percentage of female riders in December was greater than the share in 2019 (26% vs. 22% of weekday and 27% vs. 24% of weekend trips).
Winter bike riding is often heavily impacted by weather conditions; cold temperatures, snow, and ice can deter rides, as well as shut down stations. Was the increase in December ridership due to better weather? It doesn’t seem like it. While the average temperature in 2020 was warmer than 2019 (41 degrees vs. 39 degrees), the month still had above average precipitation – including the largest December snowstorm since 2010, which shut down Citi Bike service for most of the day on the 17th. December 2019 was one of the rainiest recorded in recent years, and December 2020 only had three fewer days of precipitation. In sum, the weather at the end of 2020 was comparable to that of 2019, yet ridership was notably greater. And our examination of ridership patterns—longer trips that are more concentrated in the late afternoon/evening—indicates that Citi Bike is being used more for leisure trips, rather than commuting.
Overall, the data reveal that bikers in New York are not recoiling from (or are riding in spite of) colder weather. The pandemic seems to be driving an increased number of riders, despite the enduring closures of many offices and inclement weather. Some of these rides may be taken by essential workers as a presumed “safer” alternative to more crowded public transit, but the changing time and duration patterns indicate a shift toward non-work/recreational trips.
New York Tough? Seems So.
To better understand if the increase in fall/winter ridership trend was a New York-only phenomenon, we examined ridership data from other bikeshares in cold weather cities across the nation. Did these cities experience a similar “bike boom” as New York City? And are riders braving colder temperatures in the same way as New Yorkers?
Interestingly, of the bikeshares examined, some saw greater ridership during certain months of 2020 compared to 2019. Notably, Divvy saw a large increase in ridership in November 2020, likely due to exceptionally cold weather in November 2019 and an unusually warm November 2020 (further indication that weather plays a large role in ridership). However, Citi Bike in New York was the only system to see a consistent uptick in year-over-year ridership throughout the Fall of 2020, and the only system to have an increase in rides in December 2020, compared to 2019. All five cities had pandemic responses, with March through May 2020 stay-at-home orders, phased re-openings beginning by June or July, and new restrictions beginning in mid-to-late November to counter increasing infections. While bikeshare trends fluctuated in the different cities, usage of these systems was less negatively impacted than public transit, which remained at levels less than 10% of pre-pandemic ridership throughout the summer.
Monthly Bikeshare Ridership Change From 2019 to 2020

There are several possible explanations for why New York’s system saw a difference:
With over 1,100 stations, New York’s Citi Bike is more expansive than systems in Boston, Washington, DC, Philadelphia, and Chicago. The bikeshare is also more integrated into the city’s transportation network.
The Citi Bike system also expanded significantly during the pandemic, reaching farther into Upper Manhattan and expanding into the Bronx, providing service to new populations. Between March 2019 and December 2020, the system grew from 884 stations to 1,166 stations – a 26% increase. Some other systems also expanded in 2020, but none experienced a December increase similar to Citi Bike’s.
Vehicle ownership rates are significantly lower in New York City—less than half of residents own vehicles (45%), while car owners make up the majority in Boston (66%), Philadelphia (70%), Chicago (72%), and Washington, DC (63%). With the car option at their disposal, many potential riders may have instead chosen to drive (national passenger vehicle traffic reached pre-pandemic levels by the end of June).
A more detailed analysis is needed to better understand what could have led to the decrease in bikeshare ridership in these other cities.
Policies to get riders on the streets, safely
The increase in winter biking in New York City indicates that there is demand for biking even in colder weather. In the post-pandemic era, biking is expected to take on an increasing portion of the mode share. So, what can cities do to accommodate an increasing number of bikers? And what can colder locales like Boston; Philadelphia; Washington, DC; and Chicago do to encourage more wintertime biking? A city like Copenhagen, Denmark (where biking constitutes 41% of all commuting trips despite December temperatures hovering near 35 degrees) provides policy examples.
1) Adequate Bike Infrastructure
Greater quantities of protected bike lanes are associated with greater biking rates, and lack of adequate biking infrastructure is the number one reason preventing some people from trying biking as a mode of transportation. An ample amount of dedicated space for cyclists is one of the main reasons why cycling is so popular in Copenhagen: biking is both safer and more efficient than many other places. With 250 km of protected cycle paths and 1,020 km of roadways, approximately 25% of Copenhagen’s roadways have dedicated spaces for cyclists – that is compared to less than 7% of streets in New York City, Boston, and DC, and less than 1% in Philadelphia and Chicago (based on our calculations of protected bike lane miles versus total public road miles). Copenhagen has also prioritized bicycle parking and bicycle garages. Residents become so accustomed to biking that many do not consider stopping, even in the winter.
Before any other policies can be put in place, cities must focus on creating safe spaces for cyclists—rain, snow, or shine. Creating protected cyclist-only paths, such as the newly announced Brooklyn Bridge and Ed Koch Queensboro Bridge bike lanes, is a good first step.
2) Maintaining Biking Infrastructure: Plowing
Winter biking comes with its own unique challenge: snow. During the snow itself, visibility is poor (making protected bike spaces more important). After the snow has stopped, accumulation can make it dangerous or even impossible to bike. Snow plows can take multiple hours to clear roadways, and even longer to clear dedicated bikeways (not to mention on-street bike lanes, which often get completely covered by snowbanks created by snowplows clearing the motor vehicle lanes).
In Copenhagen, salting and clearing bike lanes is prioritized even before traffic lanes. Other snowy cities have found strategies to manage long winters. If snowpack becomes too great or too consistent to clear, cities in Finland have developed a strategy of laying gravel on top of compacted snow to provide traction to cyclists.
In order to keep cyclists on their bikes throughout the winter, New York and other cities need to ensure that bikeways are treated with high priority.
3) Education Campaigns
Educational campaigns can help riders feel better prepared and more confident while biking in the winter. Part of Copenhagen’s widespread adoption of bicycling can be attributed to extensive promotional campaigns organized by the city government. Cities could aim to host events, workshops, or begin marketing campaigns that promote winter cycling as a feasible option with the correct equipment and clothing.
What can a winter cyclist do to prepare?
Beyond supporting city-level policies that help promote safe and efficient winter biking, riders themselves can take several steps and precautions to ensure that they are prepared for winter cycling. Mainly, cyclists should ensure they have the right gear, including:
Face and hand coverings: One of the main inhibitors of winter biking is the cold – and the face and hands tend to get the coldest while cycling. Wind-proof gloves or mittens made for biking can help protect your hands, while scarves (and face masks!), balaclavas or hats, and even goggles protect your face from the biting wind. Hats made specifically for use under helmets are available.
Appropriate clothing: While your first instinct may be to layer up, remember that cycling is exercise. Within a few moments you’ll be sweating under your coat. It’s best to feel a bit “underdressed” and chilly when getting on your bike since you’ll warm up quickly. A sweatshirt and a windbreaker or light jacket are often enough.
Bike Gear: There is some equipment that can make your ride smoother and safer. Make sure you have good tires (missing tread is one sign you may need to replace your tires). A fender can help protect from snow and water spatter, while lights and reflectors can ensure you are visible to drivers and other bikers. If you are thinking of getting a new bike, you may consider one with internal gears—which limits the risk of slipping a chain as well as protects the hardware from tough winter conditions and salt.
The New York City “bike boom” became noticeable by June as biking recovered more quickly than other transportation modes; by September, ridership began to exceed 2019 levels—indicating that the trend is continuing to gain traction even in the colder months. Building out bike infrastructure and prioritizing cyclists in inclement weather, as well as educating riders on winter conditions, are some steps that cities can take to both encourage and facilitate winter biking. With such approaches, as well as preparation by riders, winter biking can become a more feasible option for many in the post-pandemic era.
Additional Sources:
https://www.mass.gov/files/documents/2017/09/13/2016_ri_ye_rpt.pdf
https://ddot.dc.gov/page/bicycle-lanes
https://web.archive.org/web/20121122121841/http://www.fhwa.dot.gov/policy/ohim/hs06/htm/hm10.htm
https://chicagocompletestreets.org/streets/bikeways/barrier-protected-bike-lanes/
https://www.chicago.gov/city/en/depts/cdot/provdrs/street.html
https://bicyclecoalition.org/wp-content/uploads/2014/01/Bike-Map-2014_reduced.pdf
Transportation stories that move you. Subscribe to TransCentral today.